Student Achievement

In accordance with the Southern Association of Colleges and Schools Commission on Colleges (SACSCOC) Standard 8.1, “The institution identifies, evaluates, and publishes goals and outcomes for student achievement appropriate to the institution’s mission…,” Jacksonville State University has identified student achievement metrics, provided appropriate data, established thresholds of acceptability, and explained how each criterion relates to its mission. The student achievement measures identified by the University are:
- Eight-Year Graduation Rate
- First Year Retention Rate
- Licensure and Certification Pass Rate
- Developmental Education
Consistent with the mission of Jacksonville State University (JSU) as a learning-centered institution, the University identifies student achievement goals, presents and evaluates data related to those goals, and publishes relevant results on online through this webpage and other means. JSU increasingly relies upon student achievement data to benchmark and holistically enhance student success in all aspects of the college experience. Each institutional division shares in the responsibility of student success and works independently and collectively to that end.
Jacksonville State University's Student Achievement webpage is maintained by the Office of Institutional Research and Effectiveness and is updated each fall unless data are not available until later in the academic year. When this is the case, updates are made when data become available.
Graduation Rate: IPEDS 8-Year Outcomes
JSU selected the IPEDS 8-Year Outcomes as its completions indicator. This metric includes all first-time, full- and part-time freshmen and transfer students. Further, it represents a relatively standardized measure of JSU’s graduation rate at the undergraduate level as it is already measured and reported as required by IPEDS.
The data in Table 1 below is a summary comparing the graduation rates of JSU with state and national peer institutions.
Table 1: State and National peer graduation rate comparison by cohort year
|
*Fall 2008 |
2009-10 |
2010-11 |
2011-12 |
---|---|---|---|---|
Jacksonville State University |
40% |
42% |
46% |
46% |
State Peers |
36% |
33% |
34% |
37% |
National Peers |
58% |
58% |
58% |
60% |
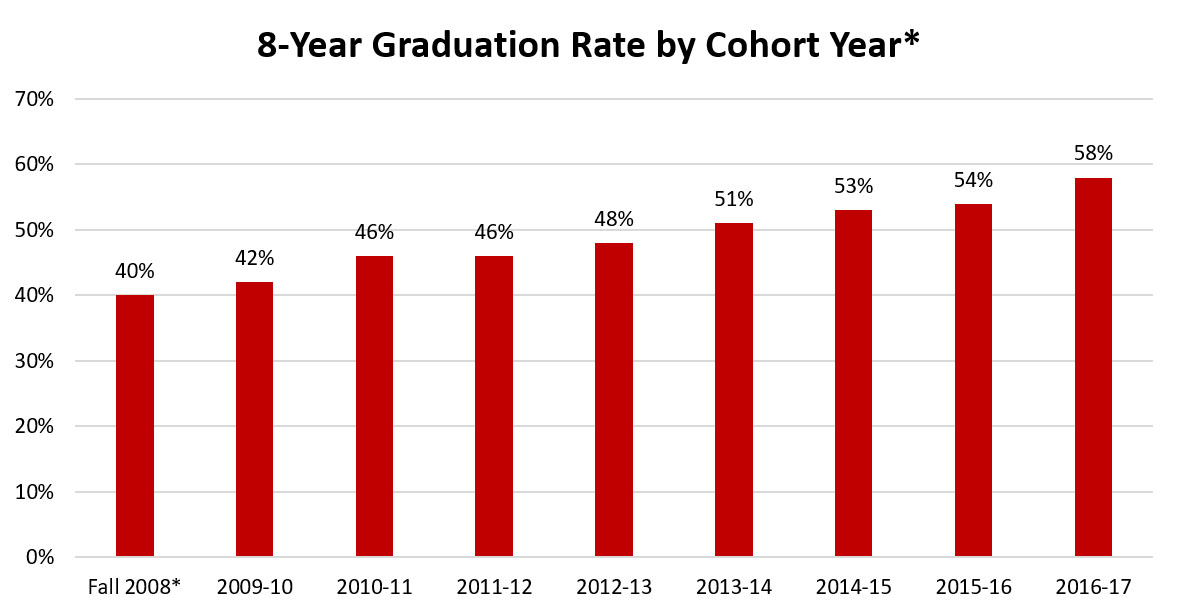
*IPEDs Outcome Measures transitioned from a Fall only cohort during the 16-17 reporting year to a full-year cohort during the 17-18 reporting year and beyond
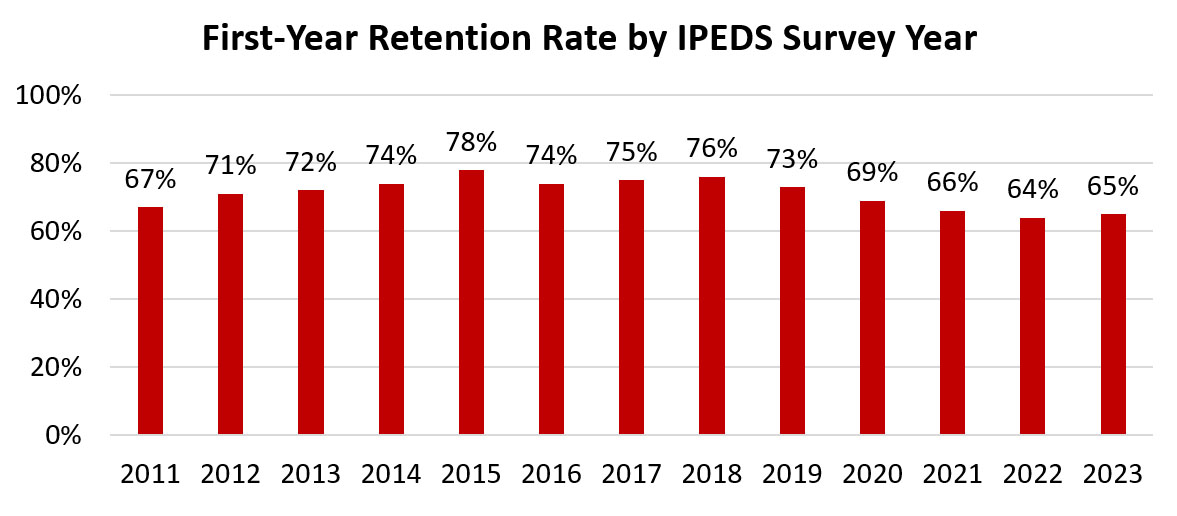
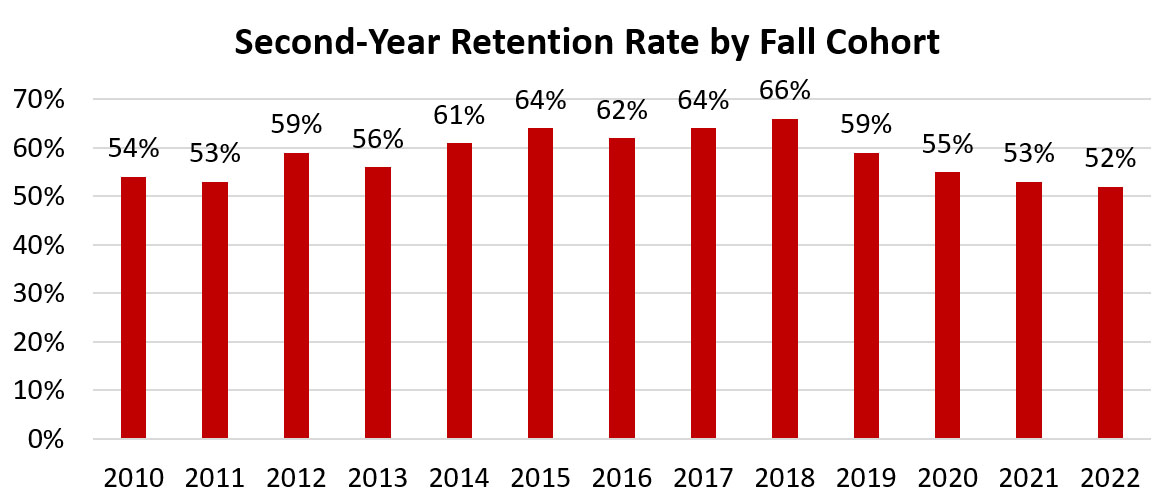
Based on a comparative analysis of those data, the following data points were selected by the Student Achievement Subcommittee.Threshold of Acceptability
JSU's Threshold of Acceptability 8-year graduation rate is 40%.
The lowest JSU 8-year graduation rate over the available reporting periods was 40% from the 2008 cohort, which is 6 percentage points below the most recent 8-year graduation rate of 46%. As JSU’s lowest recorded performance on this measure, 40% was selected as a Threshold of Acceptability for the 8-year graduation rate. A graduation rate below this level serves as a warning that intensive attention is required to address unacceptable performance on this measure.
Target Performance Level
Because of state-specific trends in high-school graduation rates and student profiles, state peer institutions provide the most relevant comparison group when assessing 8-year graduation rates. JSU’s most recent 8-year graduation rate of 46% already exceeds the average graduation rate of state peer institutions (34%). Compared individually, JSU’s 46% graduation rate also leads all other state peer institutions, with the University of North Alabama (44%) as the next highest, followed by Alabama A&M (33%). With only 3 years of data, it is difficult to determine an accurate trend line. However, JSU has increased its 8-year graduation rate by 2% to 4% each year. In keeping with this trend, JSU has established a 2% per year increase as its annual targeted gain for this measure. By continuing along this trajectory, a 2-point increase per year over the next 5 years will place JSU’s graduation rate at 56%, which, if achieved, will highlight JSU’s continued momentum while keeping its 8-year graduation rate at or near the top among state peer institutions. It will also place it very close to the national average (58%) on this outcome measure.
Aspirational Goals
The average 8-year graduation rate for national peer institutions is 58%, which is 12 percentage points above JSU’s current rate. Among national peer institutions, JSU currently ranks among the lowest in graduation rate. However, the achievement of JSU’s Target Performance Level of 56% would move it ahead of six of its thirteen national peer institutions and place it much closer to the national average of 58% among peers. Consequently, JSU has set its aspirational goal for 8-year graduation rate at 58%, the national peer average. This level of performance is being achieved by many of JSU’s peer institutions across the nation and therefore, with appropriate resources, effort, and attention, should be possible for JSU. Additionally, this goal aligns with and supports JSU’s vision statement of aspiring to be recognized for student success at a national level. Each of the data points described above is depicted in the graph below.
Demographic Profile: Among JSU's sub-populations of first-time, full- and part-time freshmen and transfer cohorts, students who are conditionally admitted are the least likely to graduate. As shown in Table 2 below, only 31% of conditionally admitted freshmen graduate within 8 years compared to 48% of unconditionally admitted students. The next least likely group to graduate is African Americans, of which only 36% graduate within 8 years as compared to JSU’s 46% overall 8-year graduation rate. Male students are also less likely to graduate than females with average graduation rates of 38% and 52% respectively. Pell Grant recipients are also among the least likely to earn a degree with an average 8-year graduation rate of 39%. Asian, Asian American, and American Indian or Alaska Native students are most likely to graduate with an average 8-year graduation rate of 57%.
Table 2: JSU Graduation Rates by Sub-Population Demographic Profile by Cohort Year
Demographic |
2009-2010 |
2010-2011 |
2011-2012 |
Overall |
42% |
46% |
46% |
Gender Subgroup: |
|||
Male |
34% |
39% |
38% |
Female |
48% |
51% |
52% |
Race/Ethnicity Subgroup: |
|||
American Indian or Alaska Native |
53% |
24% |
57% |
Asian or Asian American |
36% |
57% |
57% |
Black or African American |
31% |
33% |
36% |
Hispanic/Latino |
58% |
52% |
42% |
Native Hawaiian or Other Pacific Islander |
n/a |
33% |
0% |
White |
48% |
52% |
51% |
Other |
42% |
46% |
46% |
International |
75% |
66% |
42% |
Socioeconomic/Other Student Population Subgroups: |
|||
Pell Recipients |
34% |
39% |
39% |
Unconditional Admit |
45% |
49% |
48% |
Conditional Admit |
25% |
24% |
31% |
While data on some sub-populations fluctuate because of small sample sizes, it is clear that certain demographic groups are disadvantaged when compared to overall mean graduation rates among first-time, full- and part-time freshmen and transfer students. Based on the analysis of this and other disaggregated data, the University has recently created the Division of Student Success to focus on initiatives and efforts intended to support student achievement, especially among those least likely to successfully complete college.
Retention Rate: First-Year and Second-Year
In 2018, the Retention Rate subcommittee, a subcommittee of the Student Achievement Subcommittee of the larger Institutional Effectiveness Committee, examined the first-year retention rate for first-time, full-time freshmen at JSU. Comparisons were made with state and national peers using data available through IPEDS reports from IPEDS Survey Years 2014-2018. The data comparing first-time, full-time freshman retention rates appear in Tables 3 and 4 below and have been updated with the most recent data available. JSU also tracks the second-year retention rate for first-year, full-time freshmen, shown in Table 5.
Table 3: State Peer First-Year Retention Rates by IPEDS Survey Year
Institution Name |
2014 |
2015 |
2016 |
2017 |
2018 |
2019 |
2020* |
---|---|---|---|---|---|---|---|
Alabama A & M University |
66 |
58 |
58 |
59 |
61 |
57 |
N/A |
Auburn University at Montgomery |
65 |
65 |
67 |
68 |
67 |
66 |
N/A |
Jacksonville State University |
72 |
74 |
78 |
74 |
75 |
76 |
73 |
Troy University |
75 |
79 |
74 |
70 |
73 |
75 |
N/A |
University of North Alabama |
72 |
76 |
75 |
76 |
75 |
75 |
N/A |
University of West Alabama |
65 |
66 |
66 |
66 |
62 |
67 |
N/A |
Source: IPEDS
*State peer retention rate data not currently available on the IPEDs website.
Table 4: JSU’s National Peer* First-Year Retention Rates by IPEDS Survey Year
Institution Name |
2014 |
2015 |
2016 |
2017 |
2018 |
2019 |
2020** |
---|---|---|---|---|---|---|---|
Fayetteville State University |
74 |
79 |
67 |
78 |
69 |
74 |
N/A |
Frostburg State University |
75 |
76 |
77 |
74 |
77 |
78 |
N/A |
Georgia College & State University |
85 |
86 |
85 |
84 |
85 |
86 |
N/A |
Jacksonville State University |
72 |
74 |
78 |
74 |
75 |
76 |
73 |
New Jersey City University |
72 |
74 |
78 |
77 |
73 |
73 |
N/A |
Saginaw Valley State University |
71 |
72 |
67 |
74 |
77 |
74 |
N/A |
Salem State University |
81 |
80 |
79 |
77 |
74 |
73 |
N/A |
Stockton University |
87 |
87 |
86 |
87 |
85 |
83 |
N/A |
SUNY College at Brockport |
82 |
82 |
82 |
78 |
74 |
74 |
N/A |
Texas A & M International University |
76 |
76 |
78 |
76 |
77 |
79 |
N/A |
University of Colorado, Colorado Springs |
66 |
68 |
69 |
66 |
69 |
70 |
N/A |
University of Washington-Bothell Campus |
83 |
84 |
84 |
88 |
87 |
83 |
N/A |
West Texas A & M University |
67 |
64 |
65 |
64 |
67 |
68 |
N/A |
Western Carolina University |
78 |
80 |
80 |
79 |
80 |
78 |
N/A |
Worcester State University |
82 |
77 |
78 |
80 |
79 |
79 |
N/A |
Source: IPEDS
* National Peers as designated by the Alabama Commission on Higher Education (ACHE)
**National peer retention rate data not currently available on the IPEDs website.
Table 5: JSU Second-Year Retention Rates by Cohort Year
2012 |
2013 |
2014 |
2015 |
2016 |
2017 |
2018 |
2019 |
|
---|---|---|---|---|---|---|---|---|
Jacksonville State University |
59 |
56 |
61 |
64 |
62 |
64 |
66 | N/A |
Source: Office of Institutional Research and Effectiveness
Threshold of Acceptability:
JSU's Threshold of Acceptability for first-year retention rate is 72%.
JSU's Threshold of Acceptability for second-year retention rate is 56%.
JSU’s thresholds and goals were developed in 2018. First-year retention rate for first-time, full-time freshmen recorded its lowest performance in 2014 at 72% and its highest retention rate of 78% in 2016. The five-year average for first-time, full-time freshmen from 2014 to 2018 is 75%. The five-year average retention rate for first-time, full-time freshmen for JSU’s national peers was 76%, one percentage point higher than the JSU average. When compared to state peers, JSU’s five-year average was seven percentage points higher, 75% versus 68%.
Comparatively, JSU measures acceptably with national and state peers with respect to the first-time, full-time freshman retention rate. At the time of the study, JSU’s lowest performance on this measure, 72% in 2014, was selected as a Threshold of Acceptability for the first-year retention rate. A retention rate below this level serves as a warning that intensive attention is required to address an unacceptable performance on this measure.
The second-year retention rate average from 2012-2016 was 60%, with a low of 56% in 2013 and high of 64% in 2015, which was the high at the time this study was done. As with the first-year retention rate, JSU’s lowest recent performance (56% in 2013) serves as the Threshold of Acceptability for second-year retention rate.
Target Performance Level:
JSU’s strategic plan identifies retention rate goals for first- and second-year, full-time freshmen at 80% and 65% respectively. The first-year, full-time freshman retention rate objective of 80% is ambitious but obtainable; however, determining variables contributing to the five-year average of 75% will accelerate retention rate gains. Likewise, the second-year retention rate goal of 65% is manageable.
Aspirational Goals:
According to the National Center for Educational Statistics (NCES), the average first-year retention rate for first-year, full-time freshmen at public universities with a similar profile to JSU is 80% or equivalent to the stated goal of the JSU Strategic Plan.
Licensure & Certification Pass Rate
Students in the Teacher Education Program and in the Bachelor of Science in Nursing (BSN) Program must achieve initial licensure or certification in order to practice professionally upon graduation.
Teacher Education Program: In order to achieve initial certification in Alabama, prospective teachers must (a) earn a bachelor’s degree from an approved educator preparation program with a minimum Grade Point Average (GPA) of 2.75, (b) pass the Praxis Core Academic Skills for Educators Test (this requirement was discontinued by the Alabama State Board of Education effective August 13, 2020 and consequently by JSU at the same time), (c) pass the Praxis Subject Assessment, and (d) pass the national Teacher Performance Assessment (edTPA). Five-year data for those students completing the teacher education program are presented in Table 6, Table 7, Table 8 and Table 9 below.
Adopted performance levels for the Teacher Education Program indicators are as follows:
Grade Point Average
-
Threshold of Acceptability
JSU deems the State of Alabama’s minimum required GPA of 2.75 for the cohort as its threshold score. -
Target Performance Level
For JSU’s teacher certification candidates, a cohort average of 3.45 is the target score. -
Aspirational Goal
JSU’s aspirational goal for teacher certification candidates is a cohort average of 3.7.
Table 6: Grade Point Average
|
Minimum GPA |
JSU/SoE Completers (n) |
JSU/SoE GPA |
Statewide GPA (Mean) |
2019-20 |
2.75 |
200 |
3.61 |
N/A |
2018-19 |
2.75 |
171 |
3.54 |
NA |
2017-18 |
2.75 |
175 |
3.48 |
NA |
2016-17 |
2.75 |
164 |
3.43 |
NA |
2015-16 |
2.75 |
204 |
3.38 |
NA |
2014-15 |
2.50 |
146 |
3.41 |
NA |
Data Source: JSU Banner ARGOS Report JSH0023
Minimum GPA as required for unconditional admission to an undergraduate teacher education program and initial certification in Alabama
Praxis Core Academic Skills
-
Threshold of Acceptability
JSU’s minimum threshold of acceptability for the Praxis Core Academic Skills for Educators is 60%. -
Target Performance Level
For JSU’s teacher certification candidates, a 66% Praxis Core Academic Skills for Educators is the target performance level. -
Aspirational Goal
JSU’s aspirational goal for Praxis Core Academic Skills for Educators is 70%.
Table 7: Praxis Core Academic Skills for Educators
(This requirement has been discontinued by the Alabama State Board of Education effective August 13, 2020 and consequently by JSU at the same time).
|
JSU/SoE |
Statewide |
||||
|
Number Taking Assessment |
Number Passing Assessment |
Institutional Pass Rate |
Number Taking Assessment |
Number Passing Assessment |
Statewide Pass Rate |
2019-20* |
52 |
24 |
46.15 |
|||
2018-19 |
245 |
165 |
67.35% |
2617 |
1562 |
59.69% |
2017-18 |
227 |
151 |
66.52% |
2121 |
1204 |
56.77% |
2016-17 |
NA |
NA |
NA |
NA |
NA |
NA |
2015-16 |
NA |
NA |
NA |
NA |
NA |
NA |
2014-15 |
NA |
NA |
NA |
NA |
NA |
NA |
Data Source: ETS Pass Rates for Assessments Consisting of Subtests Report: Attending Institution; Highest Score
Note: Effective September 1, 2017, Praxis Core replaced ACT WorkKeys Basic Skills Assessment. The prescribed score on each of the three components (Reading, Writing, and Mathematics) of the Praxis Core Academic Skills for Educators is required for unconditional admission to an undergraduate teacher education program and initial certification in Alabama.
*State data unavailable
Praxis Subject Assessment
-
Threshold of Acceptability
JSU’s minimum threshold of acceptability for the Praxis Subject Assessments is 95% pass rate. -
Target Performance Level
JSU’s target performance level for the Praxis Subject Assessment is a 99% pass rate. -
Aspirational Goal
JSU’s aspirational goal for Praxis Subject Assessment is 100% pass rate.
Table 8: Praxis Subject Assessments
|
JSU/SoE |
Statewide |
||||
|
Number Taking Assessment1 |
Number Passing Assessment2 |
Institutional Pass Rate |
Number Taking Assessment1 |
Number Passing Assessment2 |
Statewide Pass Rate |
2019-20 |
||||||
2018-19 |
170 |
170 |
100% |
1488 |
1469 |
99% |
2017-18 |
168 |
166 |
99% |
1820 |
1811 |
100% |
2016-17 |
155 |
154 |
99% |
1762 |
1741 |
99% |
2015-16 |
206 |
203 |
99% |
1721 |
1710 |
99% |
2014-15 |
133 |
133 |
100% |
1644 |
1642 |
100% |
Data Source: ETS Title II Reporting Services – HEOA Summary Institution-Level Pass Rate for JSU Traditional (Undergraduate) Teacher Preparation Program Completers
Note: In cases where there are less than ten students taking the assessment, the number passing and pass rate are not reported.
1Number of completers taking one or more assessments within their area of specialization.
2Summary level “Number Taking Assessment” may differ from assessment level “Number Taking Assessment” because each student is counted once at the summary level but may be counted in multiple assessments at the assessment level.
* Data not yet available
edTPA
-
Threshold of Acceptability
JSU’s minimum threshold of acceptability for edTPA is an 90% pass rate. -
Target Performance Level
JSU’s target performance level for edTPA is a 95% pass rate. -
Aspirational Goal
JSU’s aspirational goal for edTPA is a 100% pass rate.
Table 9: edTPA
|
Jacksonville State University/SoE |
Statewide |
||
|
Number Taking Assessment1 |
Number Passing Assessment2 |
Institutional Pass Rate3 |
Statewide Pass Rate4 |
2019-20 |
203 |
200 |
99% |
|
2018-19 |
176 |
174 |
99% |
91% |
2017-18* |
97 |
93 |
96% |
82% |
2016-17 |
NA |
NA |
NA |
NA |
2015-16 |
NA |
NA |
NA |
NA |
2014-15 |
NA |
NA |
NA |
NA |
Data Source(s): Pearson edTPA edReports ResultsAnalyzer® (JSU Test Summary Reports and Pass Rate Analysis Reports)
Note: Effective September 1, 2018, edTPA became consequential for initial certification in Alabama.
1Number Taking Assessment – Number of individual students taking assessment during reported time frame
2Number Passing Assessment – Includes test retakes within reported time frame
3Institutional Pass Rate – Includes test retakes within given time frame
4Statewide Pass Rate – Based on edReports ResultsAnalyzer® (Pass Rate Analysis Reports)
*Data reported for JSU SP18 (pilot semester)
Undergraduate Nursing
To become a registered nurse, nursing students must pass the National Council Licensure Exam (NCLEX) administered by the National Council of State Boards of Nursing (NCSBN) score.
JSU’s nursing program’s average pass rate has consistently been above the minimum pass rate and, with the exception of 2014-2015, above both state and national averages as shown in Table 10.
In keeping with the Alabama Board of Nursing and CCNE passing benchmark, JSU Nursing has established the following local benchmarks:
Threshold of Acceptability: |
80% |
|
Target Performance Level: |
90% |
|
Aspirational Goal: |
95% |
Table 10. Average NCLEX Scores
Year |
JSU |
State |
National |
---|---|---|---|
2020 |
87.84 |
87.64 |
86.57 |
2019* |
94.9% |
94.8% |
85.7% |
2017-2018 |
95.1% |
93.1% |
88.3% |
2016-2017 |
91.9% |
90.4% |
86.9% |
2015-2016 |
90.9% |
90.0% |
87.5% |
2014-2015 |
81.7% |
84.6% |
84.4% |
*The Alabama Board of Nursing transitioned from fiscal year reporting to calendar year reporting in 2019.
Math and English Developmental Education
All entering freshmen are required to take JSU’s online math placement test. Entering freshmen without an acceptable English ACT score are also required to take JSU's online English placement test. Some exemptions, such as prior credit in a non-developmental math or English class, may apply. Students with test scores below the threshold for non-developmental placement have two options. They can enroll in the appropriate developmental course or they can participate in a free, self-paced, online, personalized study plan called EdReady that allows them to independently assess their specific content-area weaknesses and work through instructional modules to improve their knowledge and understanding in those specific areas. Upon achieving a satisfactory EdReady score, the student may then enroll in the appropriate credit-bearing math or English course without having to take the developmental class.
Developmental Math: While the pass rates in the developmental math course have typically ranged from 37% to 58% on the first attempt, pass or completion rates in EdReady (after having completed all components of the online study plan) have been consistently higher, ranging from 86% to 95% as noted in Table 11 below.
Further, students placed in credit-bearing math courses based on EdReady scores are significantly more likely to be successful in their credit-bearing math courses than those previously placed based on ACT scores (EdReady = 74%, ACT = 66%).
Table 11: Developmental Math Pass Rates
Math EdReady |
MS 100 |
|||||
---|---|---|---|---|---|---|
Year |
Enroll (n) |
Completion |
Completion (%) |
Enroll (n) |
Pass |
Pass (%) |
2019-20 |
1339 |
1181 |
88 |
169 |
63 |
37.3 |
2018-19 |
980 |
932 |
95 |
250 |
138 |
55.2 |
2017-18 |
1056 |
1008 |
95 |
383 |
244 |
63.7 |
2016 17 |
1248 |
1076 |
86 |
389 |
261 |
67.1 |
2015-16 |
NA |
NA |
NA |
324 |
191 |
58.9 |
-
Threshold of Acceptability
JSU's Threshold of Acceptability for EdReady Math is 86%.JSU’s lowest completion rate for EdReady Math was 86% at the time of this study and will serve as the threshold of acceptability. With only 4 years of data, this level may need adjustment over time.
-
Target Performance Level
JSU’s target performance level for this measure is 95%, which represents the highest pass or completion rate for 2 of the last 4 years. With only 4 years of data for analysis, this level may need adjustment over time. -
Aspirational Goal
The aspirational goal for EdReady Math is a 100% pass or completion rate.
Developmental English: Prior to Fall 2019, entering freshmen were placed in the appropriate English course based on their ACT score. Those students scoring below the minimal threshold were placed in a developmental English course, EH 100. However, based on the success of the math EdReady program, the University began piloting a comparable English EdReady program during Fall 2019. Under this pilot, students with a sufficient ACT score were exempted from taking the placement exam and were placed in the appropriate non-developmental English class, EH 101. However, those students with an insufficient ACT score were required to take the placement exam and were allowed to choose between two pathways. They could enroll in a developmental English class (EH 100) or, instead, work through the free, online EdReady modules until they acquired a sufficient score to be placed in a non-developmental English class (EH 101).
As shown in Table 12 below, even though the completion rates for developmental English prior to the EdReady pilot were higher (65% to 77%) than those choosing the EdReady path (47%), almost half of the students who were initially placed into developmental English bypassed developmental English through the EdReady track and were placed in a non-developmental class. Since this was the first-year pilot, it is expected that English EdReady will follow the same trajectory as math and reach 80% or more completion within the next two years. Student outcomes are currently under review and decisions will be based on forthcoming results from the Spring 2020 participants.
Table 12: English
English EdReady |
EH 100 |
|||||
---|---|---|---|---|---|---|
Year |
Enrolled (n) |
Completion (n) |
Completion (%) |
Enrolled (n) |
Pass |
Pass % |
2019-20 |
348 |
162 |
47 |
156 |
125 |
80.1 |
2018-19 |
0 |
0 |
0 |
208 |
149 |
71.6 |
2017-18 |
0 |
0 |
0 |
215 |
141 |
65.6 |
2016-17 |
0 |
0 |
0 |
162 |
125 |
77.2 |
2015-16 |
0 |
0 |
0 |
296 |
191 |
64.5 |
2014-15 |
-
Threshold of Acceptability
JSU's Threshold of Acceptability for EdReady English is 47%.JSU’s lowest completion rate for EdReady English was 47% and will serve as the threshold of acceptability. With only 1 year of data, this level will need adjustment over time.
Note: The discrepancy between the two thresholds for math EdReady (86%) and English EdReady (47%) may be explained by the fact that ALL entering freshmen take the math EdReady and only those whose performance is not at a level to allow them to enroll in the non-developmental EH 101 course, take the English EdReady.
-
Target Performance Level
Prior to the implementation of EdReady English, JSU’s average pass rate for developmental English (EH 100) was 70%. Consequently, the target performance level for Ed Ready English has been set at the same level, 70%. With only 1 year of data for analysis, this level will need adjustment over time. -
Aspirational Goal
The aspirational goal for EdReady English is a 100% pass rate.